August 2020

In this month’s Visual Insights Newsletter, we explore the transformative power of gratitude in uncertain times. Click here to see it!
July 2020

In this month’s Visual Insights Newsletter, we explore some effective ways to make better financial decisions, no matter what the market’s doing. Click here to see it!
June 2020

In this month’s Visual Insights Newsletter, we explore how asking the question “why” just three times can keep financial goals and dreams alive. Click here to see it!
May 2020
We break down the costs of kids in this month’s Visual Insights Newsletter.
April 2020
In this month’s Visual Insights Newsletter, we take a look at what sustainable investing is, how it works, and how it can be rewarding. Click here to see it!
March 2020

If you’re like most people, the first thing that comes to mind is something you didn’t do. That’s because most people tend to overlook their accomplishments at the end of a year.1
We’re not doing that in this month’s Visual Insights Newsletter. Instead, we’re looking back at the 25 most remarkable accomplishments of 2019. Click here to see it!
February 2020
When it comes to the market during a presidential election cycle, the election itself may not matter as much as you think. We explain why and look at some proven facts about the market and elections in this month’s Visual Insights Newsletter.
January 2020

So, how can you live a rich life? Do you know what your rich life looks like? In this month’s Visual Insights Newsletter, we explore these questions and share some strategies for living a richer life. Click here to check it out!
December 2019

In this month’s Visual Insights Newsletter, we explore the concept of strategic giving and its essential role in maximizing the impact of philanthropy. Click here to see it!
November 2019
In this month’s Visual Insights Newsletter, we’ll share some helpful strategies for avoiding panic so you can weather any recession. Click here to see it!
October 2019

In this month’s Visual Insights Newsletter, we’re exploring the importance of your money mindset and sharing some exercises to help you understand more about it. Click here to check it out!
September 2019

In this month’s Visual Insights Newsletter, we’ll explore some of the most undervalued luxury destinations, looking at the global events that have made them such great deals. Click here to check it out!
August 2019

In this issue of the Visual Insights Newsletter, we’ll explore these questions and much more, giving you the facts about bear markets. Click here to check it out!
July 2019

In this issue of the Visual Insights Newsletter, we share engaging conversation starters that can jump start the money talk with children and open up an ongoing dialogue.
June 2019

In this issue of the Visual Insights Newsletter, we take a look at the top jobs threatened by automation and examine trends across different industries. Click here to check it out.
May 2019

In this issue of the Visual Insights Newsletter, we discuss the growing movement of U.S. retirees heading abroad, and talk through some of the issues they face when they go.
April 2019
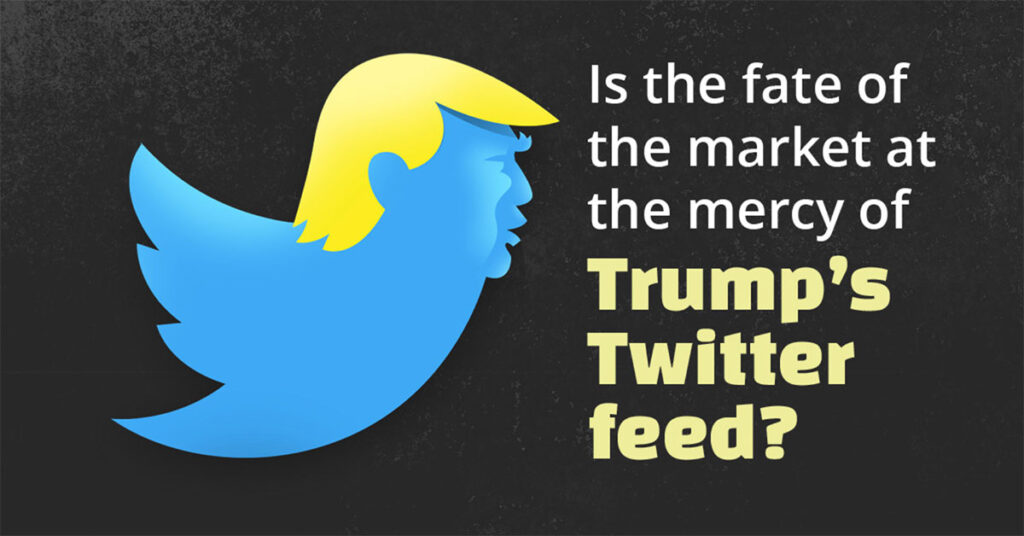
No president in history has used social media more than Donald Trump. His tweets have given us unprecedented insight into what the most powerful man in the world is thinking on an almost-daily basis.
Should investors be worried about his Twitter activities?
We break it down for you in this awesome infographic. Click here to see the full infographic!
March 2019

Are you worried about missing out on a wave of marijuana investments? We drilled into the available data in this new issue of the Visual Insights Newsletter to find out what you need to know before you invest.
February 2019
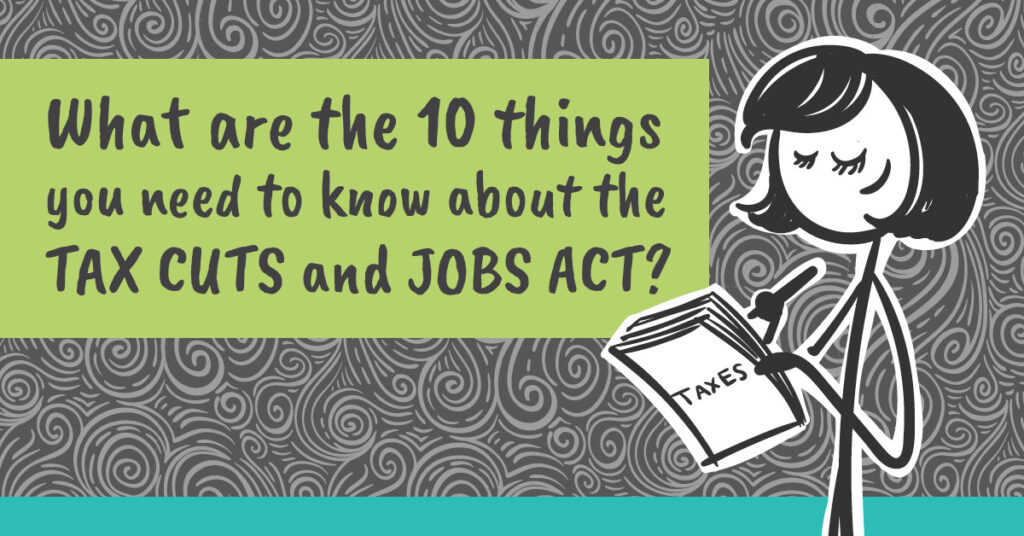
In the biggest overhaul of the tax code since the 1980s, Federal tax regulations changed at the end of 2017.1 Find out what the new regs could mean for your finances in our latest Visual Insights Newsletter Infographic.
January 2019

$1 million used to be the ultimate retirement portfolio benchmark for successful Americans. Is that still true? We ran a series of hypothetical calculations to find out how long $1 million could last in each state in our latest infographic Visual Insights Newsletter.
December 2018

Tambourines, castles, asteroids, and more…discover the many dumb financial mistakes famous people have made in our latest infographic Visual Insights Newsletter.
November 2018

Bitcoin, cryptocurrencies, and the blockchain are very hot right now and some of my clients and friends have been asking me:
- What’s Bitcoin?
- What’s a blockchain?
- Should I invest?
Find these answers and more in our latest infographic Visual Insights Newsletter.
Click here to check it out!
October 2018

Build better finances this year by overcoming your brain’s natural tendencies with the behavioral finance tricks in this infographic Visual Insights Newsletter.
September 2018
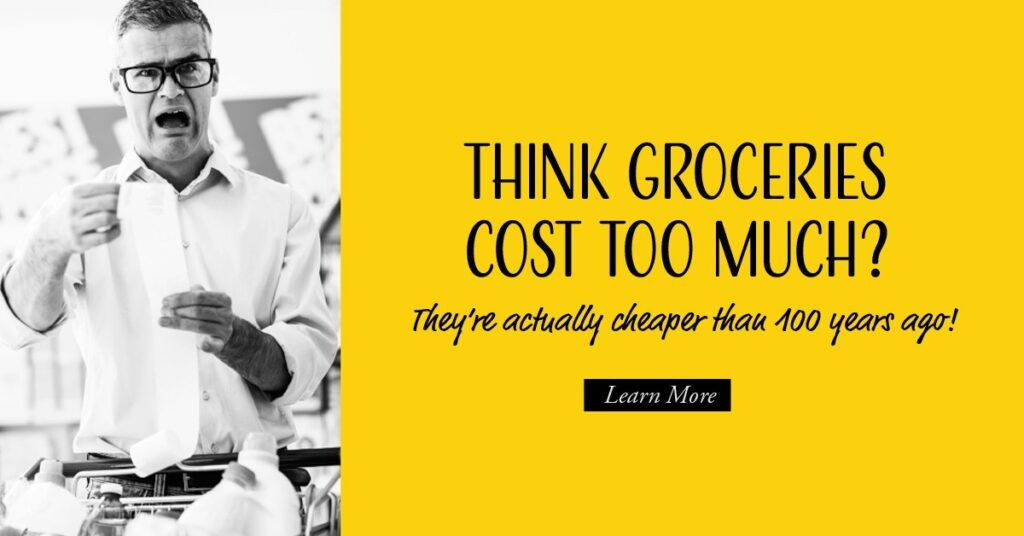
Prices can do weird things over time (which is why we test assumptions when building financial strategies for the future).
Discover more price shockers in this infographic-style Visual Insights Newsletter.
August 2018

While inheritances, bonuses, or life insurance payouts might be a lot more likely than a lottery win, the advice is the same.
Learn how to make the most of these financial windfalls in this issue of the Visual Insights Newsletter. Click here to see it!
July 2018

In this month’s Visual Insights Newsletter, we explore when, Natural disasters, terrorist attacks, war, and geopolitical standoffs with nations like North Korea and Iran, are all part of today’s world and they can affect markets in unpredictable ways. Is there anything you can do to protect your portfolio? Click here to check it out!
June 2018

Our latest Visual Insights Newsletter infographic teaches you how to view market corrections the smart way.